DATA ANALYTICS · MARKET RESEARCH · AUTOMATION · AI TOOLS

Karan Chauhan

Senior Data Analyst | Market Research, Automation & AI Tools

Transforming complex survey data into accurate, actionable insights, and building the tools that make research teams faster and more reliable.

9+Years of experience
100+Research projects supported
15+Automation tools built
QCQuality-first approach
KC

About

About me

I am a Senior Data Analyst and Market Research Specialist with 9+ years of experience managing end-to-end survey data processing and analysis for large-scale, multi-market studies.

My work focuses on transforming complex research datasets into reliable, decision-ready outputs. From data cleaning, validation and cross-tabulation to Excel/VBA automation and Power BI dashboards, I combine analytical thinking with a disciplined approach to quality control and clear communication with stakeholders.

Alongside client work I build the tools my team uses: Excel and PowerPoint macros, Python apps that turn crosstabs into decks and check decks against their source data, an AI-assisted open-end coding tool, and a full web platform that builds websites for small businesses.

📍 New Delhi, India💼 9+ years
01

My expertise

End-to-end survey data processing, quantitative research, tabulation and reporting.

02

My approach

Accuracy first, documented checks, reproducible processes and reliable delivery.

03

What I build

Tools that remove repetitive work: report automation, QA checks against source data, and AI workflows with a human check built in.

04

My technical strengths

Advanced Excel and VBA, SPSS and tabulation software, Python automation, dashboards and web apps.

05

My future direction

Bringing analytics, automation and AI together into products that research and business teams can use every day.

Skills & tools

What I work with

ExpertProficientWorking knowledgeLearning

Survey research

Expert
Survey data processingCodingCleaningValidationWeighting

Statistical analysis

Expert
Cross-tabulationSignificance testingTrend analysisSegmentation

Data quality & QA

Expert
QC rulesException reportingConsistency checksChart-vs-source checks

Excel & VBA automation

Expert
XLOOKUPINDEX-MATCHPivotTablesPower QueryVBA macrosReport automation

Statistical software

Expert
IBM SPSS StatisticsSPSS DimensionsWinCrossUncle Professional

Project delivery

Expert
Timeline managementStakeholder communicationMulti-market coordination

PowerPoint automation

Proficient
PowerPoint VBApython-pptxNative editable chartsSig-test callouts

Python for research

Working knowledge
pandasNumPyopenpyxlPlotlyDashStreamlitscikit-learn

Business intelligence

Working knowledge
Power BIDAX basicsKPI dashboardsData visualization

AI & LLMs

Proficient
ChatGPTClaudeGemini APIPrompt designAI-assisted coding (Python/VBA/SQL)AI open-end coding

Web & app development

Working knowledge
Next.jsReactTypeScriptNode.jsHTML/CSSREST APIs

SQL & databases

Working knowledge
SQL joins and aggregationsMySQLPostgreSQLSupabase

Integrations

Working knowledge
Google Places APIRazorpay paymentsResend emailCloudflareVercel

Projects & case studies

Selected work

Python app · Reporting automation

Crosstab Report Builder

Turns Excel crosstab exports into charts and presentation-ready decks: it reads question blocks, NET rows and significance colours, and offers 24 chart types.

Case study
What I built
A Dash and Plotly app with Excel and PowerPoint export. The PowerPoint charts are native and editable, not pasted pictures, so researchers can restyle them.
Tools
PythonDashPlotlyopenpyxlpython-pptx

Python app · Quality control

PPT Chart & Sig-Test QA Tool

Checks every chart and significance-test box in a research deck against the source Excel crosstabs, and exports a colour-coded QA report.

Case study
Results
On a real deck it found a bar showing 42% where the source rounds to 41%, legend values one point off, and duplicated legend boxes left over from copy-paste.
Tools
Pythonpython-pptxopenpyxl

AI · Text analytics · Streamlit

AI Open-End Coding Assistant

Builds a codeframe from open-ended survey answers with a large language model, codes each response, and compares the result with human coding.

Case study
Approach
Agreement with human coders is measured with accuracy and Cohen's kappa, so the AI coding is validated before it is used.
Tools
PythonStreamlitpandasGemini APIscikit-learn

VBA · Report automation

Excel & PowerPoint Macro Library

A set of VBA macros used on live projects: table comparison, report formatting, headers and footers, codebook merge, hyperlink updates, topline borders, significance-text updates and lining up sig-test callouts in PowerPoint.

Tools
Excel VBAPowerPoint VBA

E-commerce · Singapore · Survey analysis

Shopee Brand Study

Supported validation and analysis of e-commerce survey datasets, producing behavioral and segment-level summaries using Excel and SPSS.

  • Built a dedicated VBA QA macro for checking the study's report tables.
Tools
ExcelSPSSVBA

Digital banking · KPI reporting

Interac Bank Project

Developed KPI dashboards in Power BI and Excel to monitor digital banking satisfaction and usage.

Tools
Power BIExcel

Beauty · Multi-country research

GHD Brand Study

Processed survey data and supported dashboard preparation and structured leadership reporting.

Tools
ExcelSurvey analysis

Gaming · Audience segmentation

Gameloft Study

Supported psychographic segmentation and performance tracking for gaming audiences.

Tools
Survey analysisExcel

Beverages · Brand loyalty and trends

Asahi Beer Study

Contributed to end-to-end survey data processing and loyalty and trend analysis for brand performance evaluation.

Tools
Survey processingStatistical analysis

Analytics showcase

Dashboards & analysis

Interactive demos · synthetic data

Brand satisfaction tracker

Synthetic data, made up to show the method. Not client results.

Base (n)3,400
Satisfied (top-2 box)65%
Net Promoter Score+36
Gen Z
66%
Millennials
72% ▲
Gen X
60% ▼
Boomers
58% ▼
SegmentBaseSatisfiedvs rest of sample
Gen Z77066%no difference (z = 0.62)
Millennials115072%▲ higher (z = 6.07)
Gen X87060%▼ lower (z = -3.63)
Boomers61058%▼ lower (z = -4.04)

▲/▼ = significantly higher/lower than the rest of the sample (two-proportion z-test, 95% confidence).

Survey data quality checks

Respondent and segment KPI reporting

Cross-tabulation and significance testing

Brand tracking and trend analysis

Excel/VBA automation workflow

Crosstab-to-PowerPoint automation

Manual vs AI-assisted workflow comparison

Power BI brand health report

Work samples

Websites & other work

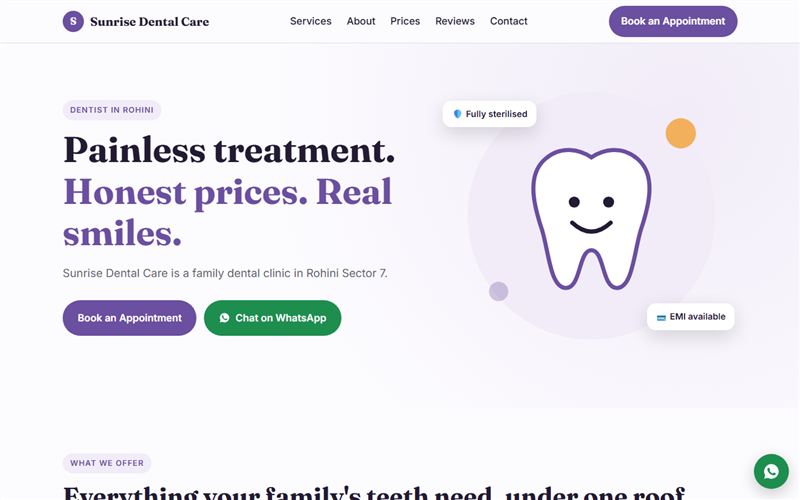
Sunrise Dental Care

Website · Dental clinic

Sunrise Dental Care

Clinic website built with my website builder: treatments with prices, FAQ, Google map, WhatsApp booking and SEO tags.

View live ↗
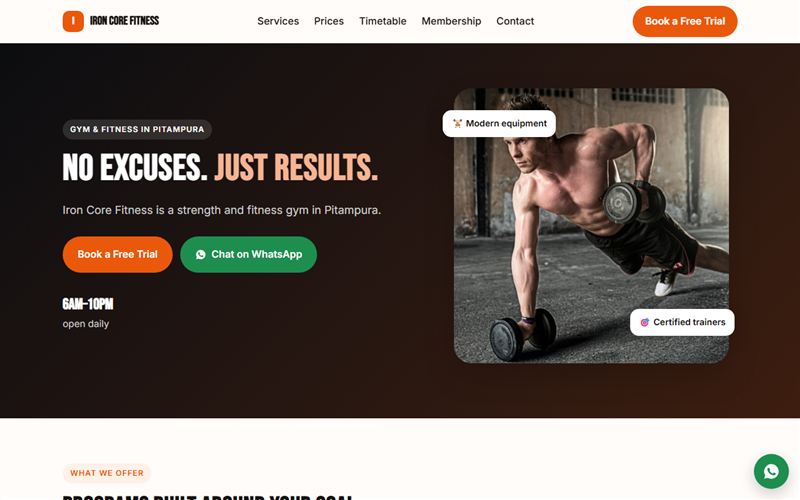
Iron Core Fitness

Website · Gym

Iron Core Fitness

Gym website with membership plans, trainer section, timings and a WhatsApp enquiry form.

View live ↗
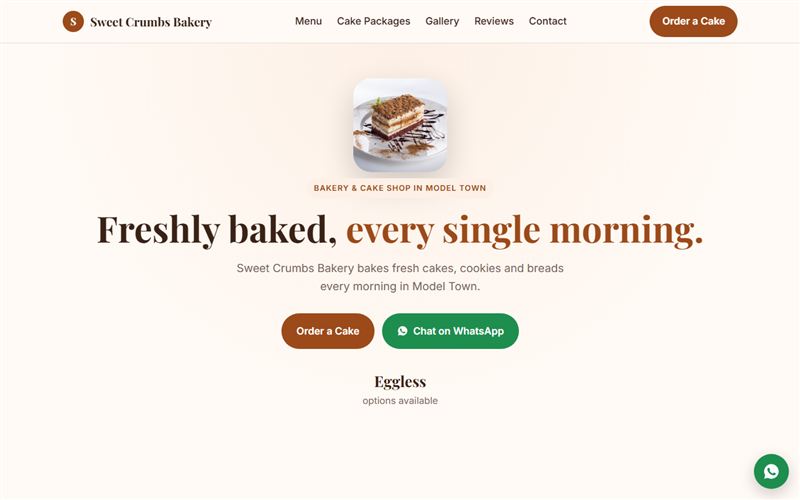
Sweet Crumbs Bakery

Website · Bakery

Sweet Crumbs Bakery

Bakery website with a priced menu, add-to-cart and orders sent straight to the shop on WhatsApp.

View live ↗
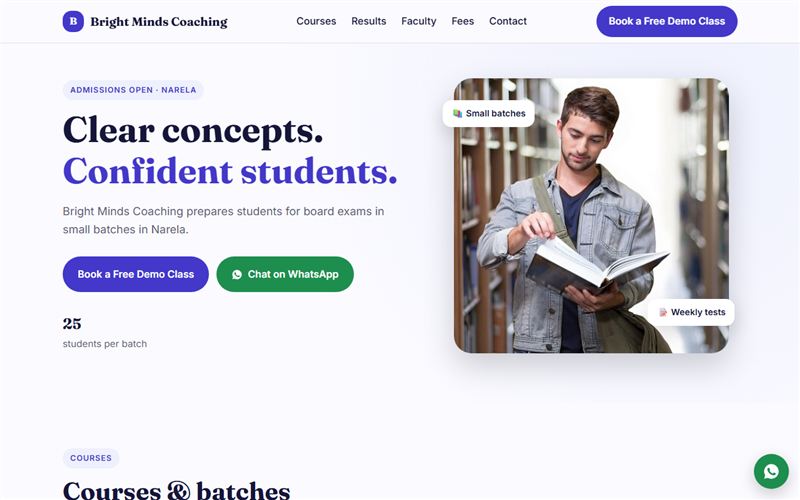
Bright Minds Coaching

Website · Coaching centre

Bright Minds Coaching

Coaching centre website with courses and fees, batch details and a parent enquiry form.

View live ↗
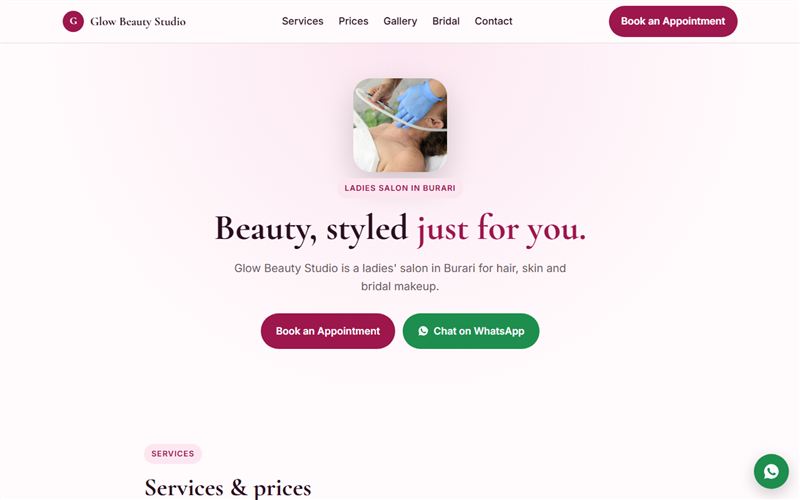
Glow Beauty Studio

Website · Salon

Glow Beauty Studio

Salon website with service prices, bridal packages, opening hours and booking on WhatsApp.

View live ↗
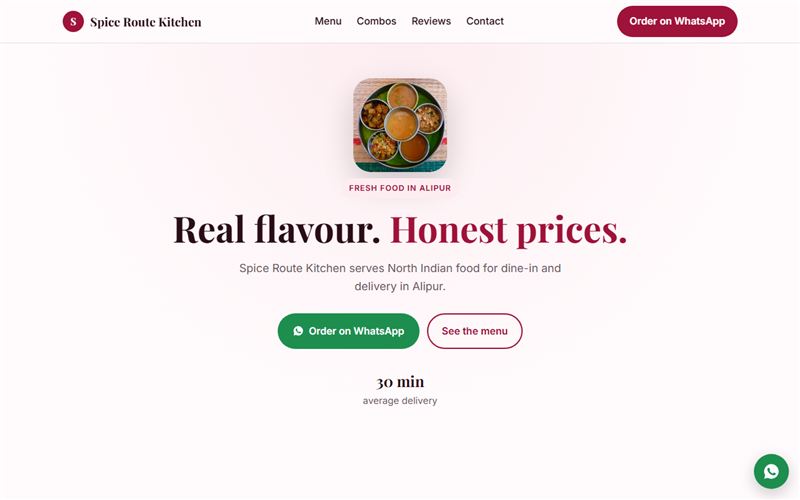
Spice Route Kitchen

Website · Restaurant

Spice Route Kitchen

Restaurant website with a priced menu, delivery details and food orders on WhatsApp.

View live ↗
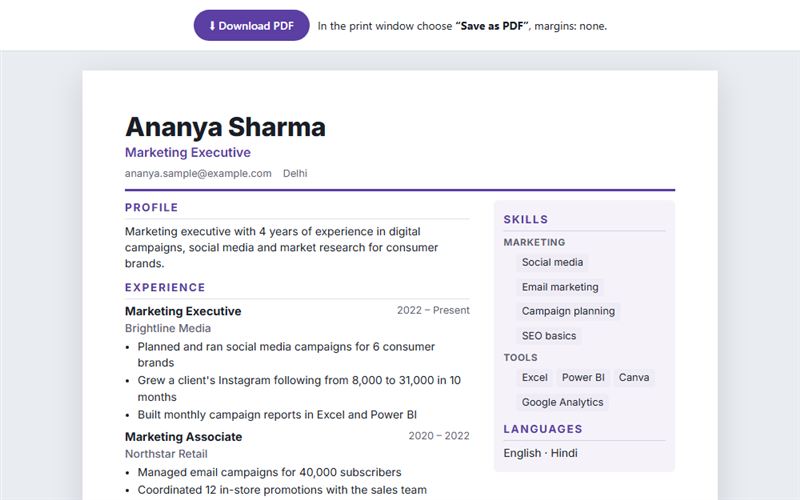
Sample résumé: Ananya Sharma

Document · Résumé

Sample résumé: Ananya Sharma

Two-column résumé from my résumé builder, with an ATS check, bullet tips and job-description matching.

View live ↗
RC

Web tool · Market research

Research calculators

Sample size, margin of error and significance-test calculators that work right on this page.

Try it ↓

Career

Experience

Senior Data Analyst

Excavate Research & Analysis Pvt. Ltd., New Delhi

January 2018 – Present
  • Manage end-to-end survey data processing including cleaning, validation, coding and tabulation for multi-country and high-volume studies.
  • Develop and maintain advanced Excel/VBA solutions to automate QC checks, statistical calculations and report generation, reducing manual effort and errors.
  • Built Python tools that turn crosstabs into editable PowerPoint charts and check finished decks against their source data.
  • Validate large datasets using rule-based checks, conditional formatting and automated exception reports to ensure data integrity.
  • Produce statistical tables, pivot-based summaries and charts in Excel and SPSS for client-ready deliverables.
  • Collaborate with project managers and field teams to track status, align on quotas and meet delivery timelines.
  • Support dashboard creation and KPI reporting in Excel and Power BI for senior leadership.
  • Started and run the company's new website and app development service (KC Website Development).

Data Analyst

Excavate Research & Analysis Pvt. Ltd., New Delhi

December 2015 – December 2017
  • Processed and validated survey data using WinCross and Uncle Professional in line with established QC standards.
  • Performed QC on raw and processed datasets, resolving issues with operations teams to maintain accuracy.
  • Assisted in statistical analysis and preparation of tables, charts and supporting documentation for research reports.
  • Built Excel analysis workbooks using PivotTables and lookup formulas for recurring and ad hoc analyses.

Education

Education

Bachelor of Technology, Electronics & Communication Engineering

MM University, Haryana, India

2011–2015

Highlights

Achievements

  • Supported 100+ survey-based research projects with consistent on-time, quality-controlled delivery.
  • Increased processing efficiency through Excel VBA automation of repetitive and complex tasks.
  • Built 15+ automation tools: Excel and PowerPoint macros, Python apps and a web platform.
  • Set up a new website and app development service for the company, from product to client outreach.
  • Commended for strong QC discipline, attention to detail and dependable communication with stakeholders.

Contact

Let's work together

Open to new roles, projects and collaborations. Send a message and I'll get back to you.